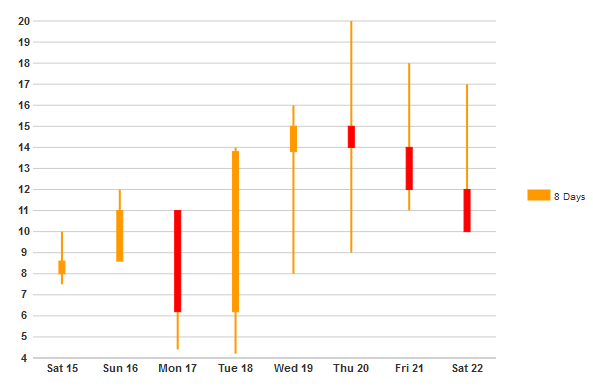
The C1CandlestickChart control allows you to choose from three types of chart: a candlestick chart, a high-low chart, or a high-low-open-close chart.
The High-Low chart is the simplest chart used for displaying financial information. It marks the highest value and lowest value of a given item in a day. You can create a High-Low chart by setting the C1CandlestickChart's Type property to "Hl":
A High-Low-Open-Close chart contains a little more information than a High-Low chart. In addition to the highest and lowest values, the chart also marks the opening and closing values of a stock. You can create a High-Low-Open-Close chart by setting the C1CandlestickChart's Type property to "Hloc":
A Candlestick chart contains the most information of all the financial charts you can create using the C1CandlestickChart control. In addition to the high, low, open, and close values of a stock, the Candlestick chart also indicates whether the stock closed up or down. In this chart, whether the stock had a falling or rising close is indicated by the color of the candle-like body. The colors can be customized using the CandlestickChartStyles properties:
